Bid-to-Win Ratio Benchmarks for Division 8 Subcontractors
Door and hardware estimators now have a baseline to measure their win rates against.

Division 8 subcontractors have no benchmark of their own. The data that exists on bid-to-win ratios covers commercial contractors and specialty subs as one undifferentiated mass, which leaves door and hardware estimators guessing at whether their numbers mean anything. This piece sets a baseline from the best subcontractor-level data available, then shows where Division 8's own estimating mechanics, takeoff speed, document reconciliation, and hardware-set logic actually move that number.
What the broader subcontractor data says about win rates
The headline figure, confirmed by 4BT: the average commercial contractor wins about 25% of the bids submitted. Two or three out of every ten. That's the number most estimators have rattling around in their head as "normal," even if nobody ever told them where it came from.
Public sector work runs lower, typically 10% to 20%. Hard-bid government contracts draw more competitors and strip out the relationship leverage that softens competition in private work. Nobody's calling a favor in on a sealed bid.
Project size moves the range just as much as sector does. Small jobs under $500,000 see win rates in the 28% to 32% range, since fewer large subs bother chasing them and competition thins out. Crossing a certain size threshold drops the average win rate to somewhere between 8% and 12%, because now the field includes every major player with the bonding capacity to compete, and each one has spent years building the relationships needed to get invited.
One more wrinkle matters specifically for subcontractors: ignoring it quietly wrecks a benchmark. A sub often prices the identical scope to several general contractors bidding the same project. That means two different ratios exist at once: win rate per bid submitted, and win rate per project pursued. Blend them together and the resulting number describes neither reality.
Reading the benchmark range: what a ratio signals about your business
A high win rate feels like success. Often it isn't. If a bid-to-win ratio never dips, that's not a hot streak, it's a pricing problem: the number says the sub is leaving money on the table on nearly every job, bidding under market instead of at it.
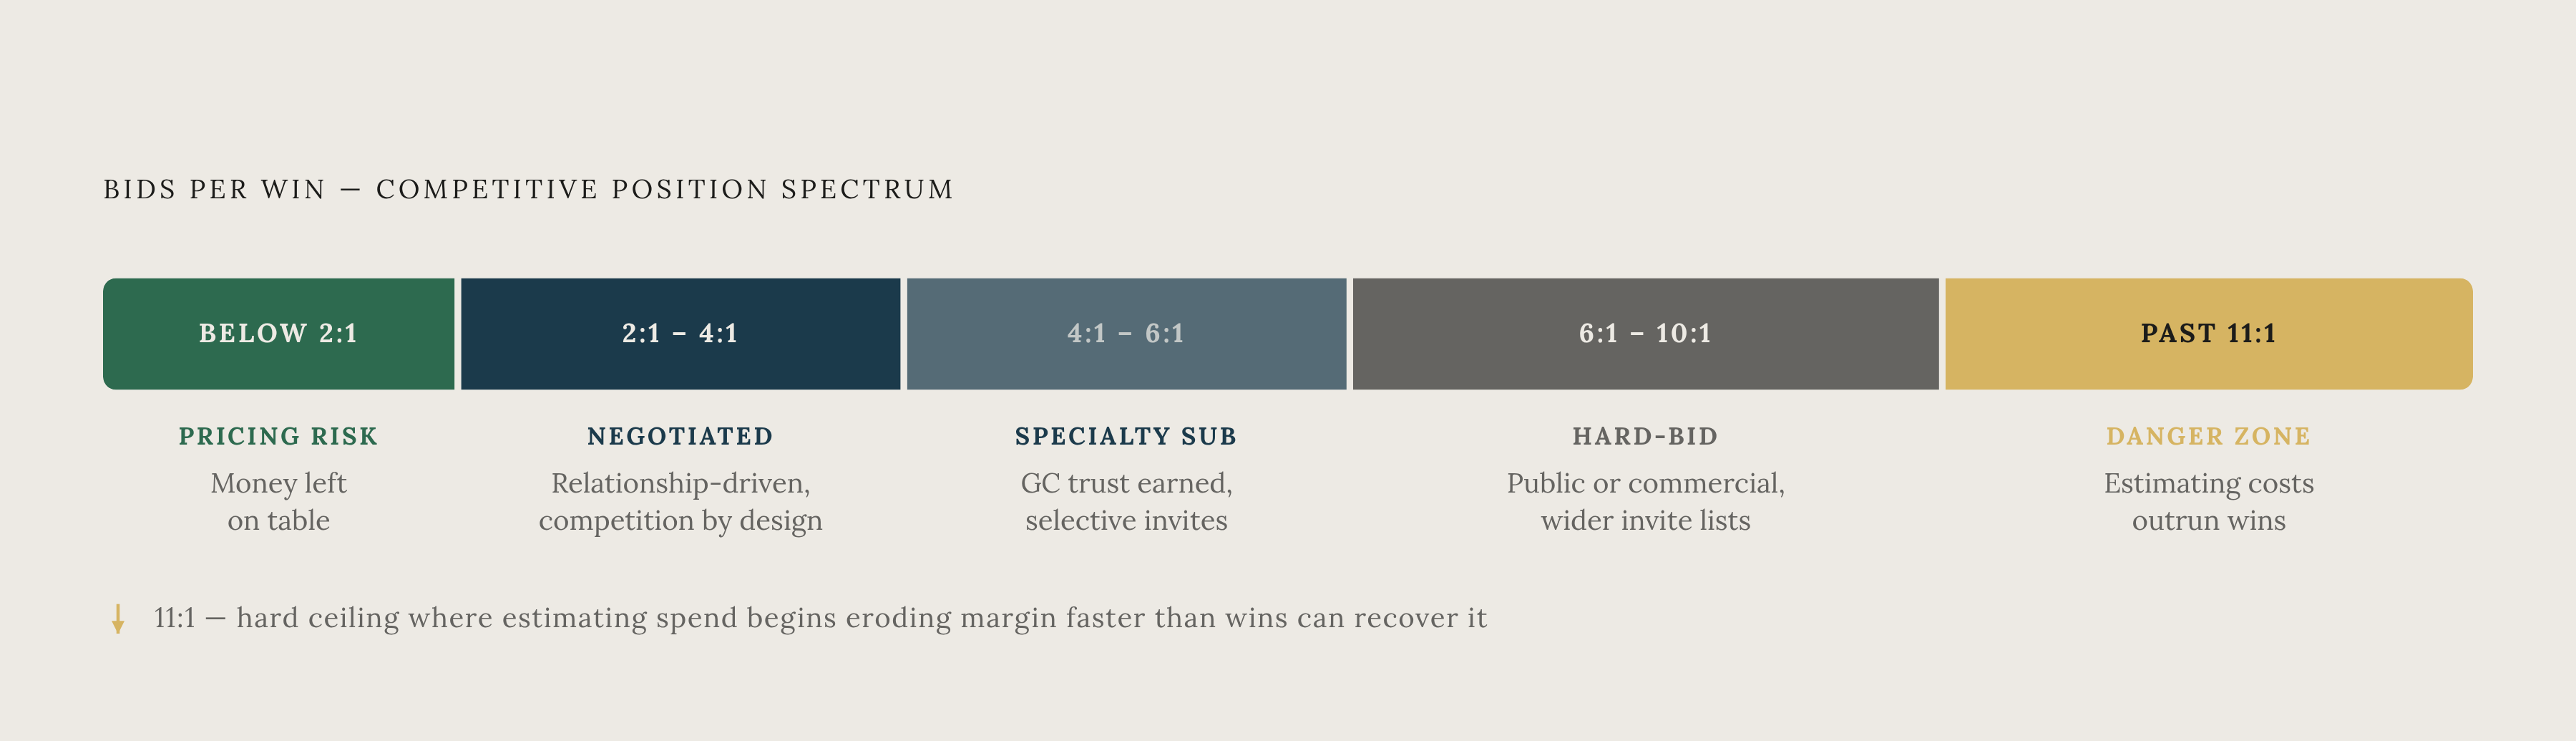
There's a ceiling on the other end too. Once a bid-hit ratio climbs past roughly 11 to 1, estimating costs start eating margin faster than wins can replace it, and the jobs that do land won't carry a reasonable profit once the pursuit cost is amortized across them. Call it the overbidding trap: chasing volume for its own sake, without the win rate to justify the estimating labor spent getting there.
Reading the range in between takes some judgment, but the bands are fairly consistent. A ratio in the 2:1 to 4:1 range reflects winning a very high share of pursued work, typical of negotiated or relationship-driven pipelines where competition is limited by design rather than by market dynamics. A 4:1 to 6:1 ratio is typical of an established specialty sub running a relationship-driven pipeline, invited onto jobs where the GC already trusts the work. A 6:1 to 10:1 ratio is normal territory for public or hard-bid commercial work, where invite lists run wide and competition is structurally higher. Past 11:1, the estimating spend is outrunning the return. At that point, it's time to tighten bid selection rather than chase more opportunities.
Delivery method explains a lot of the spread. Negotiated work carries a higher margin per project but costs more to pursue relative to the deals actually closed. Public and hard-bid work produces higher win ratios on paper but demands far more estimating throughput to sustain, since so many bids go nowhere. The two paths tend to balance out at the bottom line, just through different mechanics.
Why Division 8 estimating complexity is the variable most benchmarks ignore
None of the ratios above account for what actually makes a Division 8 takeoff difficult, and that issue is reconciling conflicting information across schedules, specs, and plans.
A door and hardware takeoff is never a single-document exercise. The estimator has to hold the door schedule, the floor plans, the partition schedules, the elevation drawings, and the 08 71 00 hardware specification in view at once, because these documents routinely disagree with each other, and the takeoff is only as accurate as the estimator's ability to catch where they diverge.
The door schedule functions as the backbone of the entire estimate. A tag like "Door 101, 3'-0" x 7'-0", hollow metal, 90-minute fire-rated, HW-3" routes the estimator into Hardware Group 3 of the spec, and that single reference then dictates every hinge, closer, latch, and seal for that opening. Misread the tag once, and the error doesn't stay contained to one door: it propagates across every instance of that hardware set on the project, which on a large building could mean dozens of openings built to the wrong assembly.
Fire ratings compound the reconciliation burden further. The five standard commercial ratings, 20, 45, 60, 90, and 180 minutes, each carry distinct assembly requirements that must be matched correctly to every opening sharing that rating. Missing a rating on one opening type means the mistake isn't isolated: it's a non-compliant assembly repeated across every door sharing that type.
Conflicts appear in practice that are mundane on their face but expensive in consequence. A door schedule lists a 3'-0" width while the floor plan shows a 2'-8" rough opening. A spec section calls for stainless finish while the schedule says galvanized. A hardware group in the spec includes a closer that the door schedule never references. None of these are exotic errors. They're the ordinary friction of a takeoff process that asks one person to hold four or five documents in their head simultaneously, and none of the broad subcontractor benchmarks above account for that friction.
Bid volume capacity: why the number of bids you can produce is a win-rate lever
Selectivity gets treated as a virtue in bidding, and within reason it is. Top performers in competitive bidding tend to pursue only 30% to 40% of the opportunities available to them, choosing jobs that fit their capabilities, their existing relationships, and their strategic goals rather than bidding everything that crosses the desk.
But selectivity only works as a strategy if there's enough volume flowing through to actually be selective about. A sub who can only complete a handful of takeoffs in a given cycle isn't choosing the best 30% of the market, they're bidding whatever they had time to finish, and calling the result a strategy after the fact.
The math beneath the ratio makes this plain: two contractors can share an identical win rate while generating very different revenue, because the ratio reflects proportion, not volume. The ratio alone does not show this. The ratio alone can't distinguish a thriving pipeline from a starved one, throughput does.
Getting on a general contractor's invite list compounds this advantage. Subs on a pre-screened invite list tend to compete in a narrower field, because the GC has already vetted the relationship and the track record before the bid even lands. But staying on more invite lists over time requires bidding responsively and reliably enough that GCs keep including the sub, and responsiveness is fundamentally a throughput problem: it's about how many bids a shop can turn around, at what speed, without the quality slipping.
How takeoff accuracy protects win rate from eroding after award
Winning the bid isn't the finish line, and treating it that way is where a lot of margin quietly disappears. A win built on an undercount, missed doors, misread hardware groups, spec conflicts nobody caught before submission, doesn't stay a win once the job starts. Those errors surface as change order disputes, or worse, get absorbed as unbilled losses, and either outcome erodes the exact margin that made the bid worth pursuing.
Much of this traces back to sequencing. Reading the door schedule first, then the spec, then the plans, one after another, means any conflict between them surfaces late, once the sequence is already finished. The corrected approach is simultaneous cross-referencing across all the relevant document types. A document-by-document march treats each one as complete on its own, and that assumption is the flaw.
Submission quality carries its own weight in the ratio, separate from pricing. A professional bid package, itemized costs, clear exclusions, documented schedules, can raise win rates by as much as 40%. But producing that level of polish by hand, on every single bid, throttles throughput and keeps a shop bidding fewer jobs than the market would otherwise support.
Discipline around pre-bid RFIs is where the best estimators separate themselves. Identifying a document conflict before bid day, rather than discovering it after award, is precisely what pre-bid RFI procedures exist for. A well-timed RFI does two things at once: it protects the scope of the bid, and it signals to the GC that the sub actually knows how to read a Division 8 package.
What AI-assisted takeoff changes about the volume-accuracy tradeoff in Division 8
The manual workflow for a Division 8 takeoff follows a fairly fixed sequence: count the openings off the plan and door schedule, group them by type, build the per-opening assembly, door slab, frame, hardware, sealant, trim, labor, and roll all of it into a schedule of values. Each step gets done document by document, in order.
The reconciliation step is where the time disappears and where the errors get introduced. Cross-referencing a door schedule against the 08 71 00 spec against the floor plan, by hand, on a project running into hundreds or thousands of openings, is the actual constraint. It limits speed and it limits accuracy at the same time. A manual process causes both limits together, so the two rarely improve together in that process.
General-purpose takeoff software handles counting openings well enough. General-purpose takeoff software fails to account for the Division 8 document ecosystem that produces those counts, because it treats openings as simple items to tally rather than as entries tied to schedules, specs, and hardware groups. It doesn't read hardware sets, doesn't flag a fire-rating conflict between a schedule and a spec section, and has no concept that a hardware group reference in a door schedule points to a section of the spec that must be checked against it in the same pass, not afterward.
An estimating platform built specifically around Division 8, one that reads door schedules, elevations, partition schedules, floor plans, and 08 71 00 specs simultaneously rather than sequentially, removes the reconciliation bottleneck at its source. That bottleneck is the primary reason manual takeoffs run slow and the primary reason errors survive into the final bid. Fixing the sequencing problem is what lets volume and accuracy move together instead of trading off against each other.
Building your own benchmark
The starting discipline is the two-track system described earlier: track per-bid win rate and per-project win rate as separate numbers. A Division 8 sub pricing the same scope to three different GCs on one project will otherwise distort a single blended metric beyond usefulness.
Track the numbers at three intervals. Monthly gives an operational pulse, catching a bad stretch before it becomes a quarter's worth of lost revenue. Quarterly is where trends actually become visible, since a single month's data is too noisy to draw conclusions from. Annually is the point for strategic calibration, when the whole approach to bid selection may need to shift.
What to capture alongside each bid matters as much as the win/loss outcome itself. Project type: new construction, renovation, institutional, public or private. Project size band, since the benchmark range shifts meaningfully at scale, with data showing distinct win-rate patterns for projects under $500K compared to those over $25M. Delivery method: hard bid, invited or selective, negotiated. The win/loss outcome itself, and wherever it can be obtained, the reason behind it, price, scope, relationship, responsiveness. Turnaround time from receipt of the bid documents to submission.
The data earns its keep once patterns emerge across those fields. Losing consistently on price within a specific size band points to one of two problems: either the takeoff is producing overcounts that inflate the price, or the market positioning in that segment needs a hard look. Losing on scope or exclusions is a reconciliation problem, plain and simple: missed items become visible during the GC's bid comparison rather than during the estimator's own review. A low response rate to invitations altogether signals a throughput constraint: the sub is getting eliminated before the bid is ever evaluated on its merits, simply because it didn't get turned around in time.
None of these patterns are visible in the broad industry-wide averages. They only show up once a Division 8 sub starts keeping a benchmark built around its own document complexity, its own throughput, and its own reconciliation discipline, rather than borrowing a number that was never built with fire ratings and hardware groups in mind.